Optuna Hyperparameter Tuning
Optuna is a hyperparameter optimization framework for machine learning models. It can help automate and streamline the process of tuning the hyperparameters.�
It’s quite popular among Kaggle users and you’ll see it used within competitions.
In this article, we will go over an example of using it on a basic dataset. There is also a YouTube video if you want to watch a video instead of reading an article.
Before we start, we are going to have to import a few things.
 import seaborn as sns
 import pandas as pd
 from sklearn.model_selection import train_test_split
 from sklearn.ensemble import RandomForestRegressor
 from sklearn.metrics import mean_absolute_error, mean_squared_error, r2_score
 import optuna
 from sklearn.model_selection import cross_val_score
 import matplotlib.pyplot as plt
Now it’s time to create a dataframe. We are going to load the healthexp dataset from seaborn
healthexp = sns.load_dataset('healthexp') healthexp.head(100)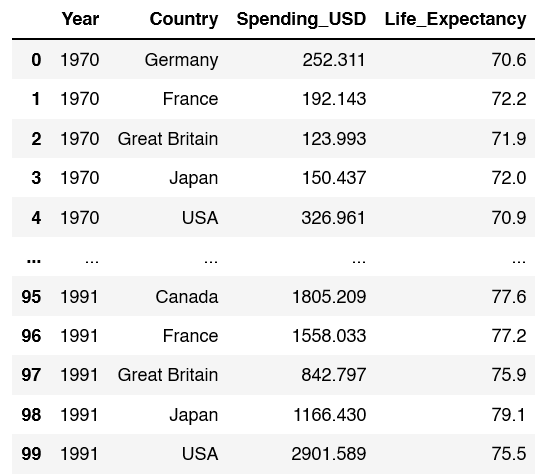
healthexp = pd.get_dummies(healthexp)Now it’s time to split our data into X and Y dataframes. On the X side of things, drop the target which is Life Expectancy. Y set to Life Expectancy.
 X = healthexp.drop(['Life_Expectancy'], axis=1)
 y = healthexp['Life_Expectancy']
Now set up train test split with a test_size of 0.2. Feel free to choose a random_state of your liking.
X_train, X_test, y_train, y_test = train_test_split(X, y, test_size=0.2, random_state=19)For this article, we are going to use a basic Random Forest Regressor.�
rfr = RandomForestRegressor(random_state=13) rfr.fit(X_train, y_train) y_pred = rfr.predict(X_test)Now that we fit the model and ran a prediction, let’s take a look at a few statistics. In particular mean absolute error, mean squared error, and the r2 score.
mean_absolute_error(y_test, y_pred) mean_squared_error(y_test, y_pred) r2_score(y_test, y_pred)MAE: 0.25916363636361917
MSE: 0.10221141818181628
R2: 0.9910457602615238
With these benchmarks, let’s take a look at using Optuna
Optuna Example
The first thing we need to do is define an objective function. Inside the function create the hyperparameters you want to test.
def objective(trial): n_estimators = trial.suggest_int('n_estimators', 100, 1000) max_depth = trial.suggest_int('max_depth', 10, 50) min_samples_split = trial.suggest_int('min_samples_split', 2, 32) min_samples_leaf = trial.suggest_int('min_samples_leaf', 1, 32) model = RandomForestRegressor(n_estimators=n_estimators, max_depth=max_depth, min_samples_split=min_samples_split, min_samples_leaf=min_samples_leaf) score = cross_val_score(model, X, y, n_jobs=-1, cv=5, scoring='neg_mean_squared_error').mean()Then we create a study. I’m going to use seed=42.
study = optuna.create_study(direction='maximize', sampler=optuna.samplers.RandomSampler(seed=42)) # Default is random SearchOptimize your study, send in the parameters of objective and the amount of trials.
study.optimize(objective, n_trials=100)Next grab the best hyper parameters and values.
 best_params = study.best_params
 best_score = study.best_value
print(f"Best Hyperparameters: {best_params}")
print(f"Best Accuracy: {best_score:.3f}")Best Hyperparameters: {‘n_estimators’: 358, ‘max_depth’: 34, ‘min_samples_split’: 2, ‘min_samples_leaf’: 2} Best Accuracy: -1.860
Visualizing the Optuna Results
optuna.visualization.plot_optimization_history(study)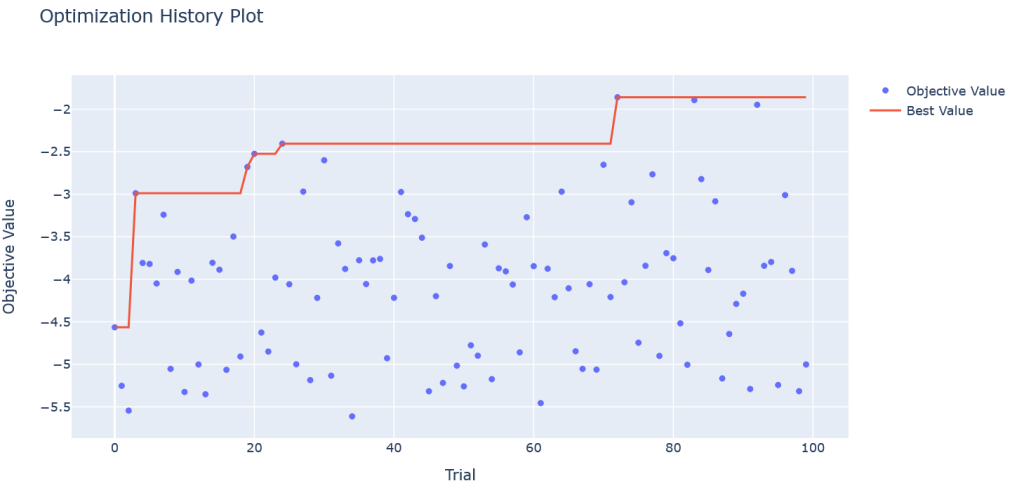
optuna.visualization.plot_parallel_coordinate(study)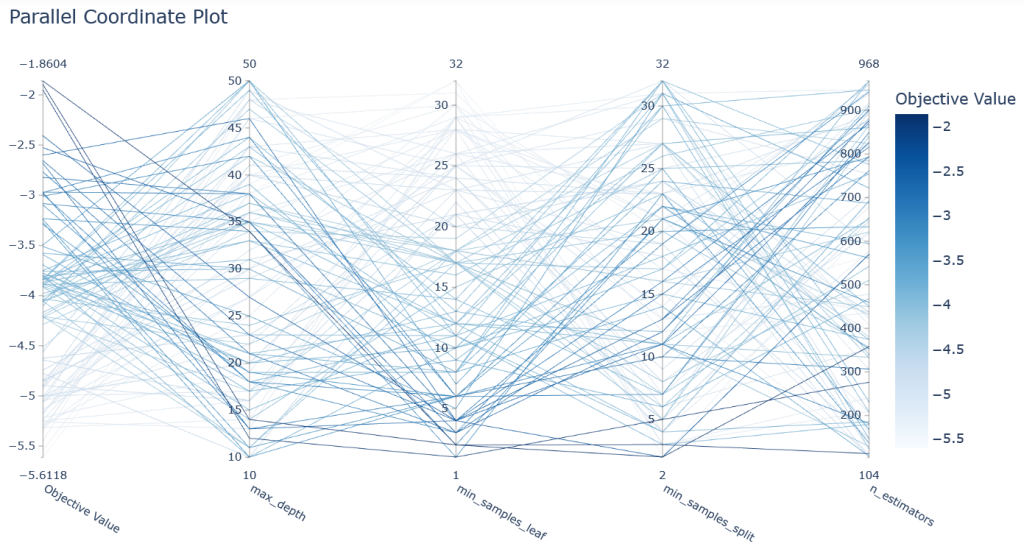
optuna.visualization.plot_slice(study, params=['n_estimators', 'max_depth', 'min_samples_leaf', 'min_samples_split'])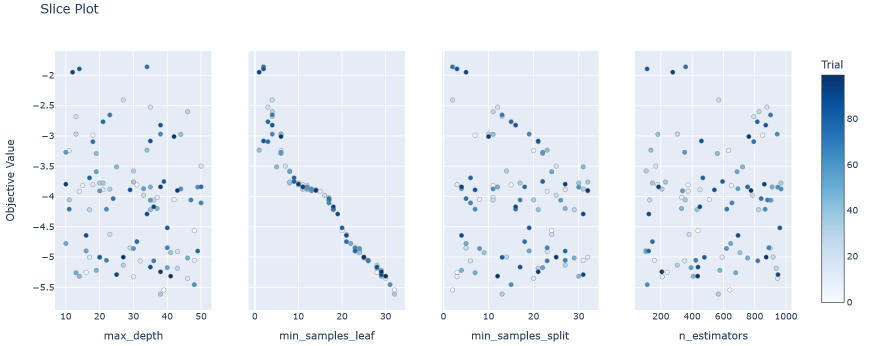
optuna.visualization.plot_param_importances(study)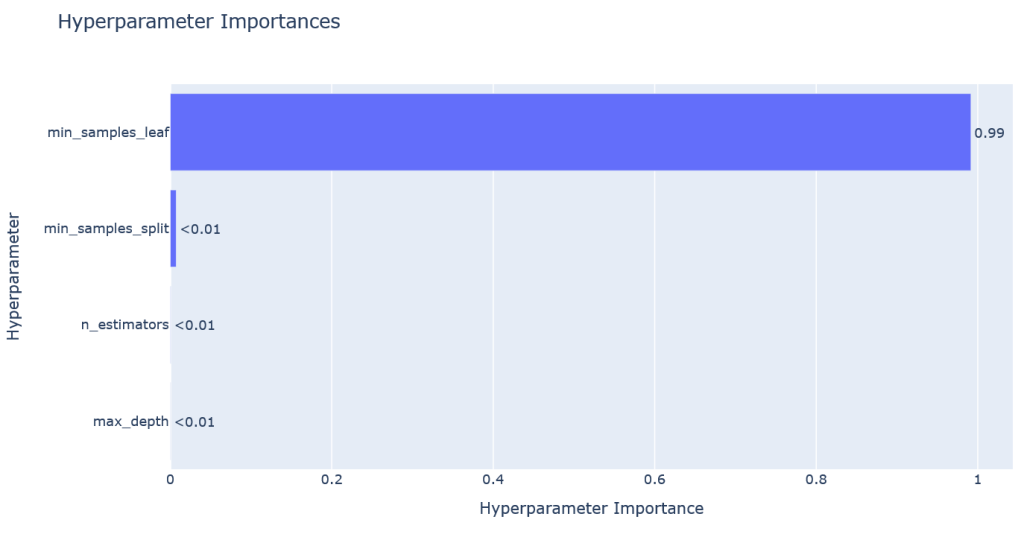
Lets grab each hyperparameter from the dictionary.
 best_n_estimators = best_params['n_estimators']
 best_max_depth = best_params['max_depth']
 best_min_samples_split = best_params['min_samples_split']
 best_min_samples_leaf = best_params['min_samples_leaf']
Then lets rebuild our random forest regressor with the parameters from optuna.
 best_model = RandomForestRegressor(n_estimators=best_n_estimators, max_depth=best_max_depth, min_samples_split=best_min_samples_split, min_samples_leaf=best_min_samples_leaf)
 best_model.fit(X_train, y_train)
y_pred = best_model.predict(X_test)Let’s compare the results to what we had earlier
mean_absolute_error(y_test, y_pred) mean_squared_error(y_test, y_pred) r2_score(y_test, y_pred)MAE: 0.3089099265527784
MSE: 0.13917245887029073
R2: 0.9878077852368601