Python Pandas GroupBy
Many data analysts begin their journey with SQL, learning how to use GROUP BY to aggregate and summarize data. As they advance, they often transition to Python for more complex data manipulation.
One of the key features in Python’s Pandas library is the groupby function, which allows for powerful and flexible data grouping and aggregation. This article will introduce you to the basics of using groupby in Pandas, helping you enhance your data analysis skills with Python.
Let’s start by importing in Pandas, Numpy, and Seaborn.
 import pandas as pd
 import numpy as np
 import seaborn as sns
Using Seaborn, we are going to import in the Tips data set. This takes a look at the tips provided at a restaurant with features including total_bill, sex, smoker, day, time, and size. Let’s look at the first 5 rows.
 df = sns.load_dataset('tips')
 df.head(5)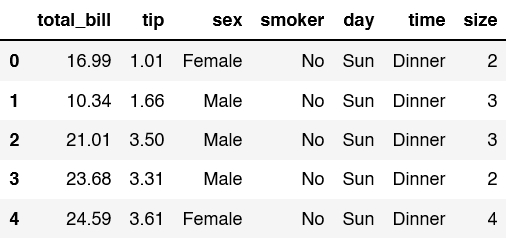
For our first groupby example, let’s find the mean for lunch and dinner. We group by the time and find the mean for the total_bill.
Groupby Single Calculations
df.groupby('time')['total_bill'].mean()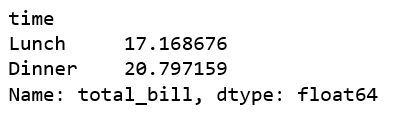
If you want to see the above represented nicer in a table use to_frame()
df.groupby('time')['total_bill'].mean().to_frame('Avg_bill')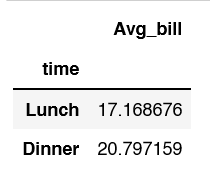
When creating a new dataframe from the groupby you’ll often see reset_index used.�
df.groupby('time')['total_bill'].mean().to_frame('Avg_bill').reset_index()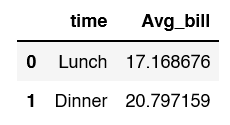
If you want to sort your dataframe, in descendingorder, add the parameter, ascending= False.
df.groupby('time')['total_bill'].mean().to_frame('Avg_bill').reset_index().sort_values('Avg_bill', ascending = False)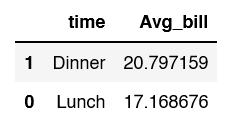
The next 3 methods all can count enteries in a dataframe, but there are slight differences.
Count: Number of non-null entries in each column or row
df.groupby('time')['total_bill'].count()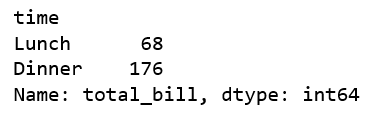
Size: Number of entries in each column or row
df.groupby('time')['total_bill'].size()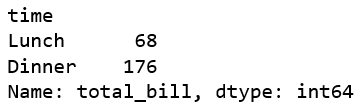
Size: Number of unique entries in each column or row
df.groupby('time')['total_bill'].nunique()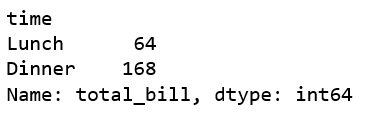
Using max will give you the highest total bill for lunch and dinner.
df.groupby('time')['total_bill'].max()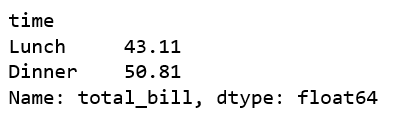
Using min will give you the smallest total bill for lunch and dinner.
df.groupby('time')['total_bill'].min()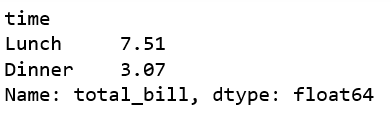
Sum will add up all the total bills for each time (lunch or dinner)
df.groupby('time')['total_bill'].sum()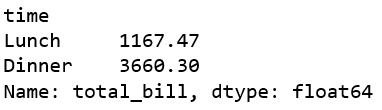
The median is the middle value.
df.groupby('time')['total_bill'].median()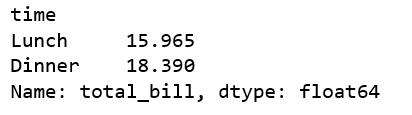
Python Pandas GroupBy Practice Problems
Question 1: Find the Average Tip for each night of the week
df.groupby('day')['tip'].mean()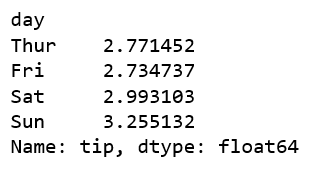
Question 2: Find the Max Tip for each sex
df.groupby('sex')['tip'].max()
Question 3: What's considered a top 10% tip for each night
df.groupby('day')['tip'].quantile(.9)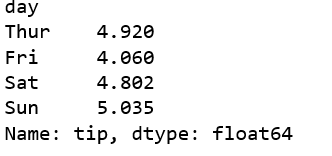
Multiple Calculations
Let’s expand on some of our last examples. To start grab the min and max from the total_bill for Lunch and Dinner.
df.groupby('time')['total_bill'].agg(['min', 'max'])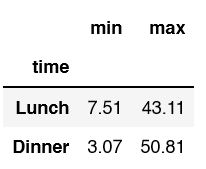
Within .agg we can implement methods from the Numpy library. You can see I use min without quotes and max with single quotes.
df.groupby('time')['total_bill'].agg([min, 'max', np.median]) df2 = df.groupby('time')['total_bill'].agg(minimum='min', maximum='max', median = np.median)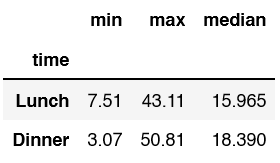
You can also rename the final columns in the dataframe instead of relying on the default min, max, and median.
df.groupby('time')['total_bill'].agg([min, 'max', np.median]).rename(columns = {'min':'minimum', 'max':'maxinum'})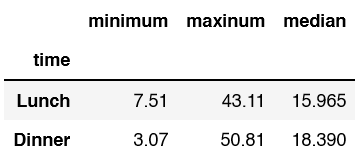
Describe will give you a lot of information that you may find helpful. This includes count, mean, standard deviation, min, 25%, 50%, 75%, and max.
df.groupby('time')['total_bill'].describe()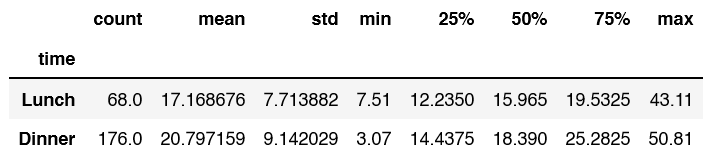
So far throughout the tutorial, we have been focusing directly on the total_bill. What if we wanted to look at total_bill as well as the tip.
df.groupby('time')[['total_bill', 'tip']].mean()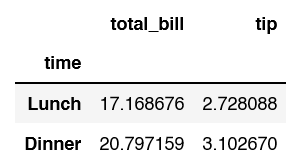
We can add to the above code and also look at grouping by time and day,
df.groupby(['time', 'day'])[['total_bill', 'tip']].mean().reset_index()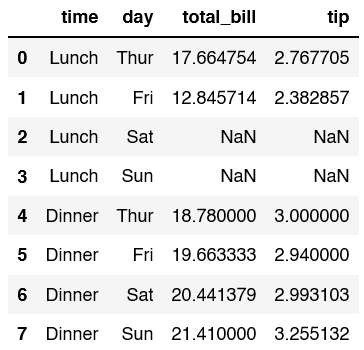
There are null values in this dataframe, let’s fill those with 0.
df.groupby(['time', 'day'])[['total_bill', 'tip']].mean().reset_index().fillna(0)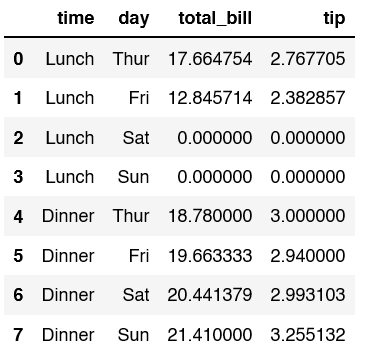
dftransform = sns.load_dataset('tips')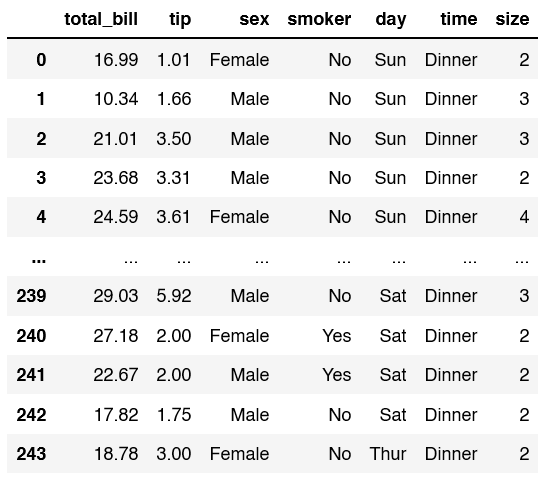
using transform, you can add an additional column to a dataframe based on a groupby. In this example we use the median for total_gill by time
dftransform['mediumtips'] = dftransform.groupby('time')['total_bill'].transform('median')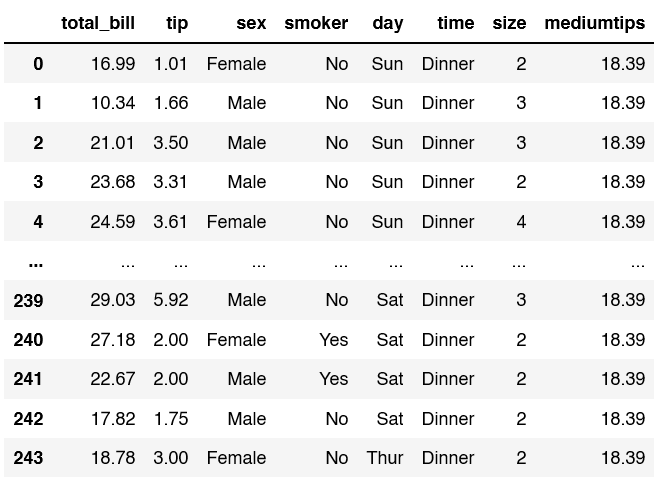
You can then filter the dataframe as you like with the new column.
dftransform[dftransform['mediumtips'] < dftransform['total_bill']]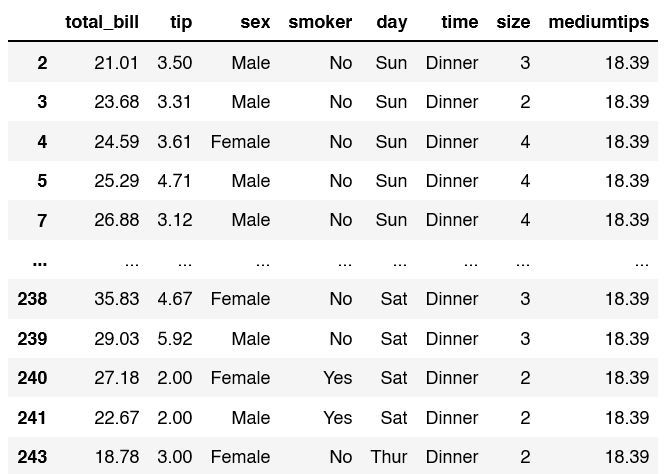
When using transform you can also utilize lambda functions. This lambda function creates a zscore.
dftransform['zscore'] = dftransform.groupby('time')['total_bill'].transform(lambda x: (x - x.mean()) / x.std())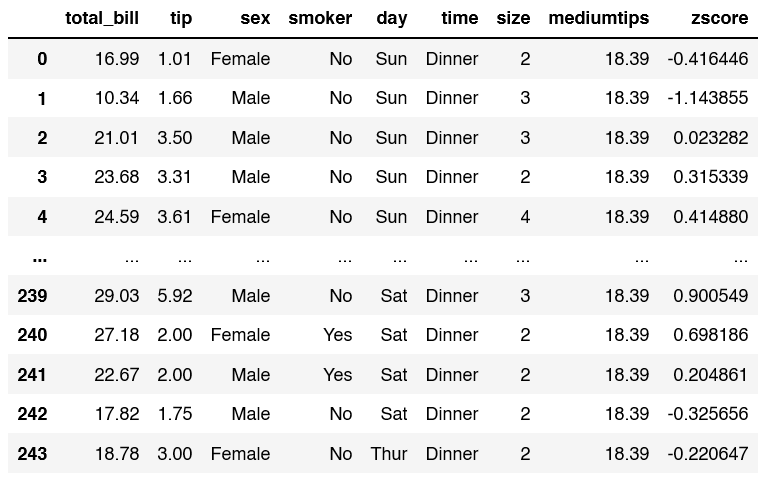
Lambda functions can also be used with .apply.
dftransform.groupby('time').apply(lambda x: (x['tip']/x['total_bill']).mean()).to_frame('tip_percent').reset_index()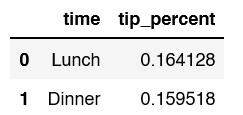
Python Pandas Practice Questions Part 2
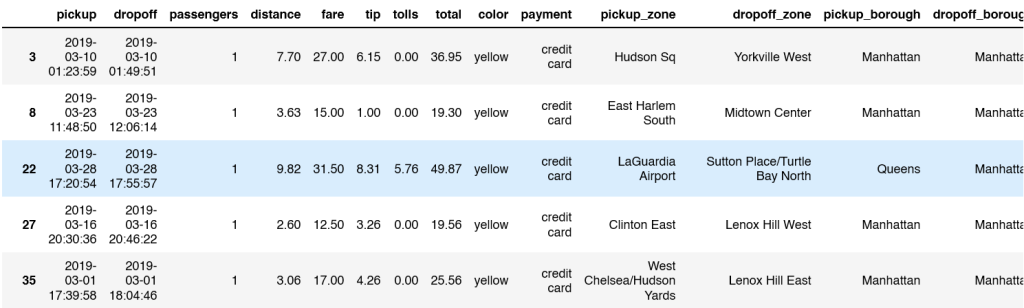
Instead of tips, let’s analyze a taxi dataset for the last practice questions in the article.�
tx = sns.load_dataset('taxis')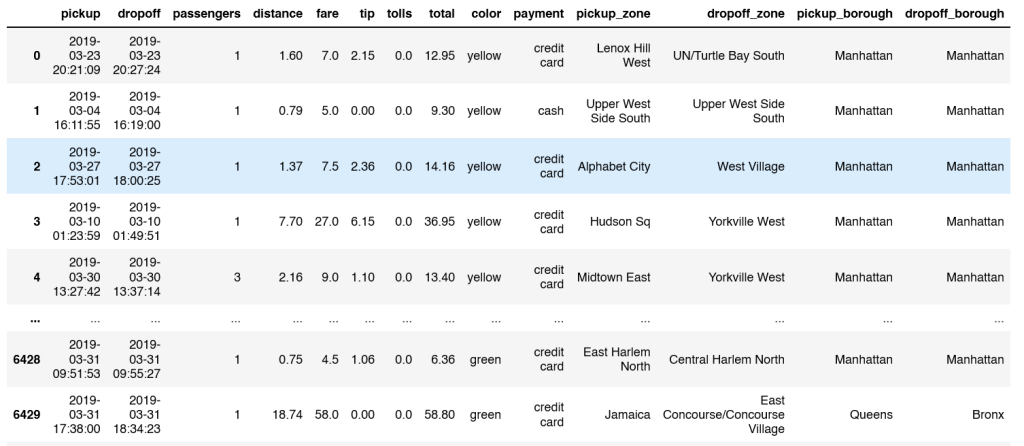
tx.groupby(tx['pickup'].dt.month)['distance'].mean()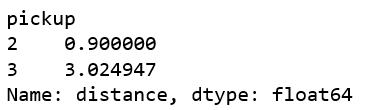
Q4 Find the Interquartile Range Q3-Q1 for Tips within Boroughs
tx.groupby('pickup_borough').apply(lambda x: x['tip'].quantile(.75) - x['tip'].quantile(.25))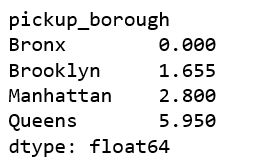
Q5 Find the Mean, Min, Max Fare for Payment Type and Taxi Color
tx.groupby(['payment', 'color'])['fare'].agg(avg = 'mean', minimum='min', maximum='max')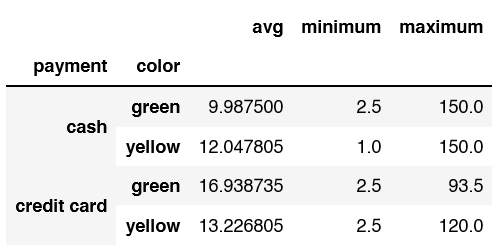
#question 3a Output the avgtotal for taxi color total to each row
Q6a Add the average total for a taxi color to each row in the dataframe
tx['avgtotal'] = tx.groupby('color')['total'].transform('mean')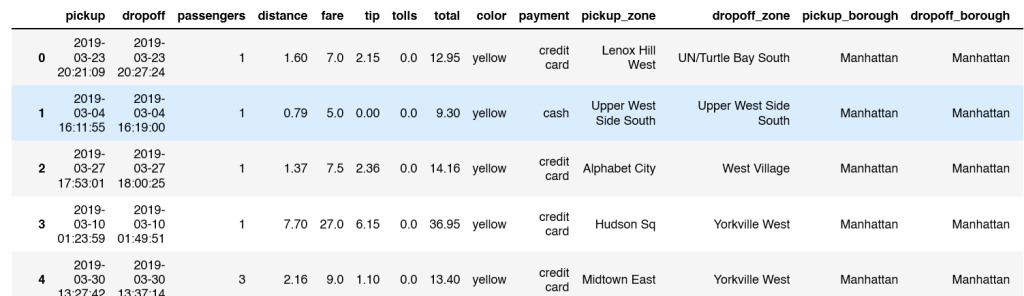
Q6b Only Show the rows that have a greater total than the average
tx.query('total > avgtotal')